Data TCGplayer Market Price vs 1.9 Million Real Sales
TCGplayer's "market price" is the figure most collectors quote when they price a card. It shows up on the card page, the price guide, and every Google Shopping listing.
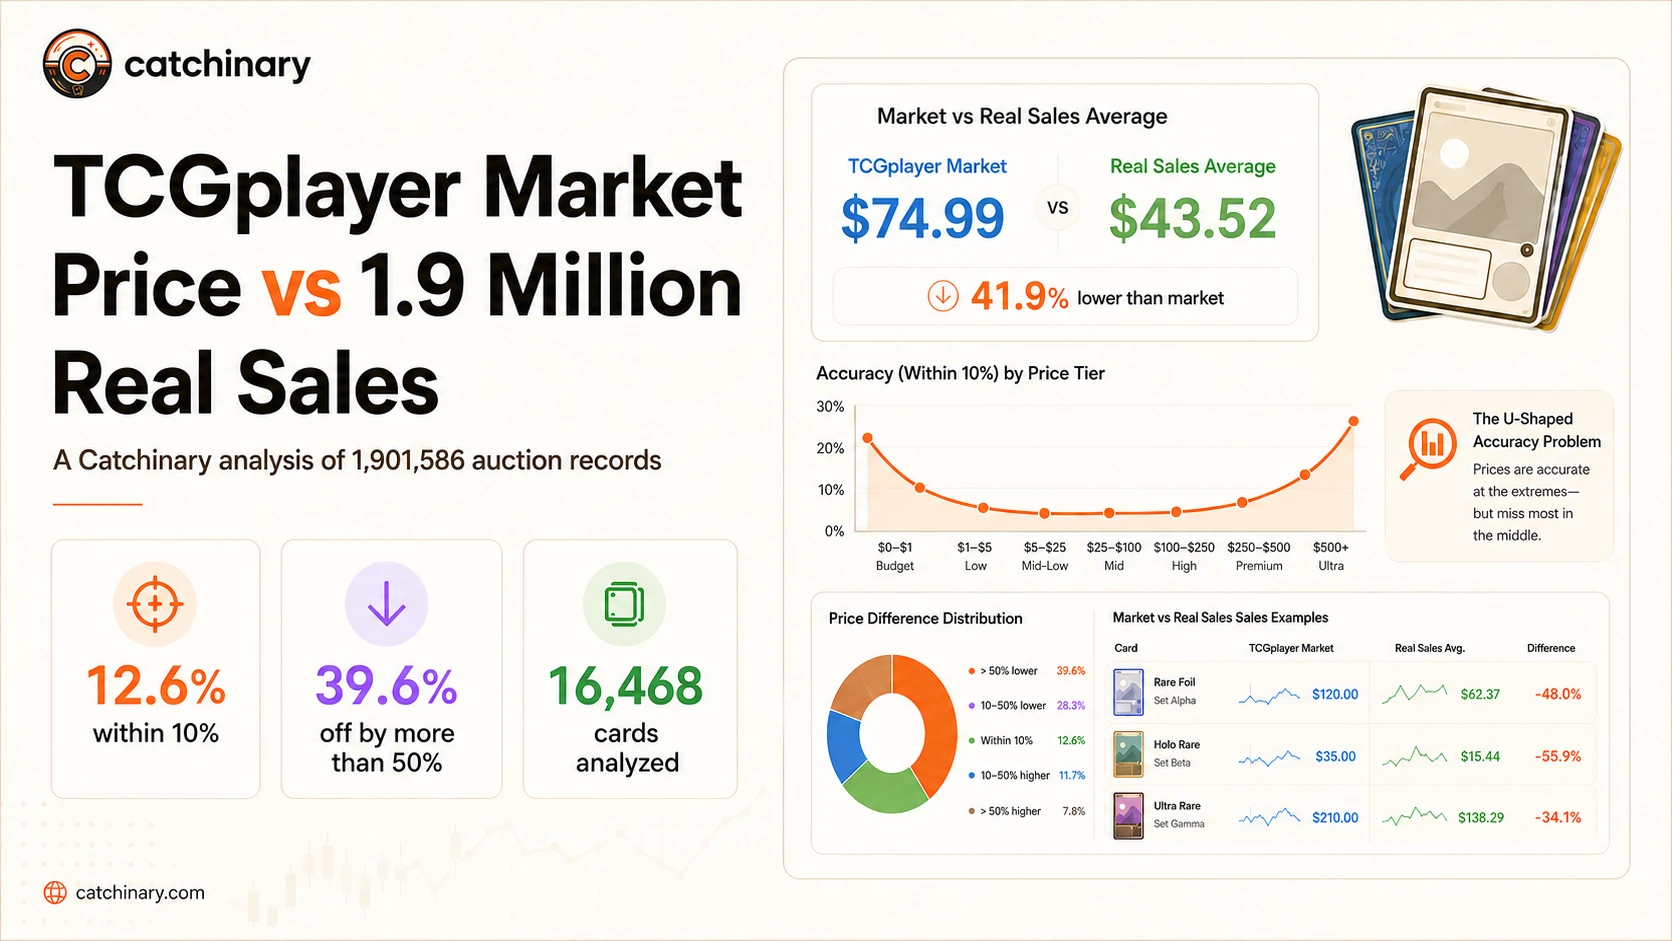
We compared that number to 1,901,586 real sold-auction records spanning 2006 to 2026.
After filtering to 14,734 cards with at least four monthly RAW data points in Q1 plus April 2026 and dropping per-card outlier months, only 14.4% had a TCGplayer market price within 10% of the real sold median. Roughly 1 in 3 were off by more than 50%.
The bigger story is the shape of the error. TCGplayer market price isn't randomly wrong. It's systematically wrong in opposite directions at different price tiers, and the middle of the market suffers worst.
Key takeaways
- Across 14,734 cards with verified recent sales (median methodology, outlier months dropped), only 14.4% of TCGplayer "market" prices land within 10% of the real sold median. 35.8% are off by more than 50%.
- The error follows a U-shaped curve by price tier. Cheap and mid-tier cards both miss, but the $25 to $500 range is worst. Only 5 to 7% of cards in that range have TCGplayer market prices within 10% of reality.
- The miss flips direction at the top. TCGplayer overstates mid-tier vintage rares (average 44 to 56% high) and understates $2,000+ chase cards (average 72% low).
- Cards like Shining Charizard from Neo Destiny sit at $1,248 real vs $3,999 TCGplayer market, a 220% overstatement. Flareon Gold Star from Power Keepers shows the same pattern: $596 real vs $2,000 TCGplayer.
- For any card above $25, treat TCGplayer market as one data point. Cross-check against live sold-comp data before buying, selling, or insuring.
The 14% headline
The clean version of the finding: across 14,734 cards that survived the strict filter, only 2,120 had a TCGplayer market price within 10% of the real sold median. That is 14.4%.
Widen the tolerance to 25% and the number rises to 34.6%. Even at the loose plus-or-minus 50% threshold, only 64.2% of cards are inside the band.
Roughly 1 in 22 cards is off by more than 100%. On a $500 card, that means a $1,000 quoted market price, or a $250 quoted market price.
Both happen. Which direction depends almost entirely on the price tier the card sits in.
Methodology
The dataset comes from Catchinary's card_auction_history table, which aggregates two sources: a Kaggle-archived dump of PriceCharting-style monthly aggregates running 2020 to 2024, and an in-house historical-auction ingest running 2006 through April 2026.
Across both sources we have 1,901,586 sale records covering 17,440 distinct cards. Grade tags include PSA 1 through PSA 10, BGS 9.5, BGS Black Label, CGC equivalents, and RAW (ungraded).
For this audit, the Q1 plus April 2026 RAW slice comes entirely from the in-house source (68,542 monthly aggregate points before filtering).
For this audit we applied these filters in order:
- RAW grade only, so we're comparing like with like against TCGplayer's ungraded market figure.
- Sale dates between January 1, 2026 and April 30, 2026 (four monthly data points per card maximum).
- At least 4 monthly aggregate points per card (require all four months of the window). Drops thin-liquidity cards entirely.
- Outlier-month drop: for each card, compute the median across its months. Any month where the price is below half or above double that median is excluded. If fewer than 4 months survive, drop the card.
- Rarity guard: Common and Uncommon-rarity cards whose surviving median exceeds $20 are dropped (upstream classification noise, where graded sales or alt-art variants ended up tagged as RAW Commons in the source).
- A non-null TCGplayer market price on the card's current record.
That left 14,734 cards in the comparison set, down from 16,468 before the v2 filters.
The drop breakdown: 9 cards dropped for too few months, 1,373 dropped because their outlier months tanked the survivor count below 4, and 360 dropped by the rarity guard.
For each surviving card we computed the median of the kept months and the percentage gap to TCGplayer's current market figure, then aggregated by price tier. The reproducible query lives at scripts/run-strict-divergence-audit.mjs with the full JSON output at scripts/strict-audit-results.json on the Catchinary repo.
Known limitations. Monthly aggregates are not individual eBay invoices, so each "data point" is itself an average of however many real transactions happened that month at the upstream source. We can't separate price drift inside a month from sample-size noise.
Building a database that matches 17,000+ Pokemon TCG cards across multiple historical data sources also introduces roughly 1 to 2% classification noise: automated string-matching scripts occasionally map a cheap base-rarity card to a same-numbered stamped staff promo, a booster box, or an unrelated retro game.
We caught and blacklisted eight specific examples while writing this audit, including a base-common Voltorb mapped to a Cosmos Professor Program staff promo, a base-common Flabébé mapped to a Flashfire Booster Box via set-name string collision, and a base-uncommon Circhester Bath mapped to the NES game Bubble Bath Babes via the word "Bath".
Those eight bad mappings have been nulled out in the source map and the 375 polluted rows have been deleted from the auction-history table. The remaining classification noise rate is bounded by the rarity guard filter described above.
The aggregate U-curve finding is robust to residual noise. Individual per-card numbers should be treated as best-available rather than gospel, and cross-checked against live eBay sold listings if money is moving.
The accuracy U-curve
Plot accuracy by price tier and the pattern is unmistakable. TCGplayer's market figure is decent on penny commons (where the absolute miss is small even if the percentage is large), terrible in the collector sweet spot, and broken at the top.
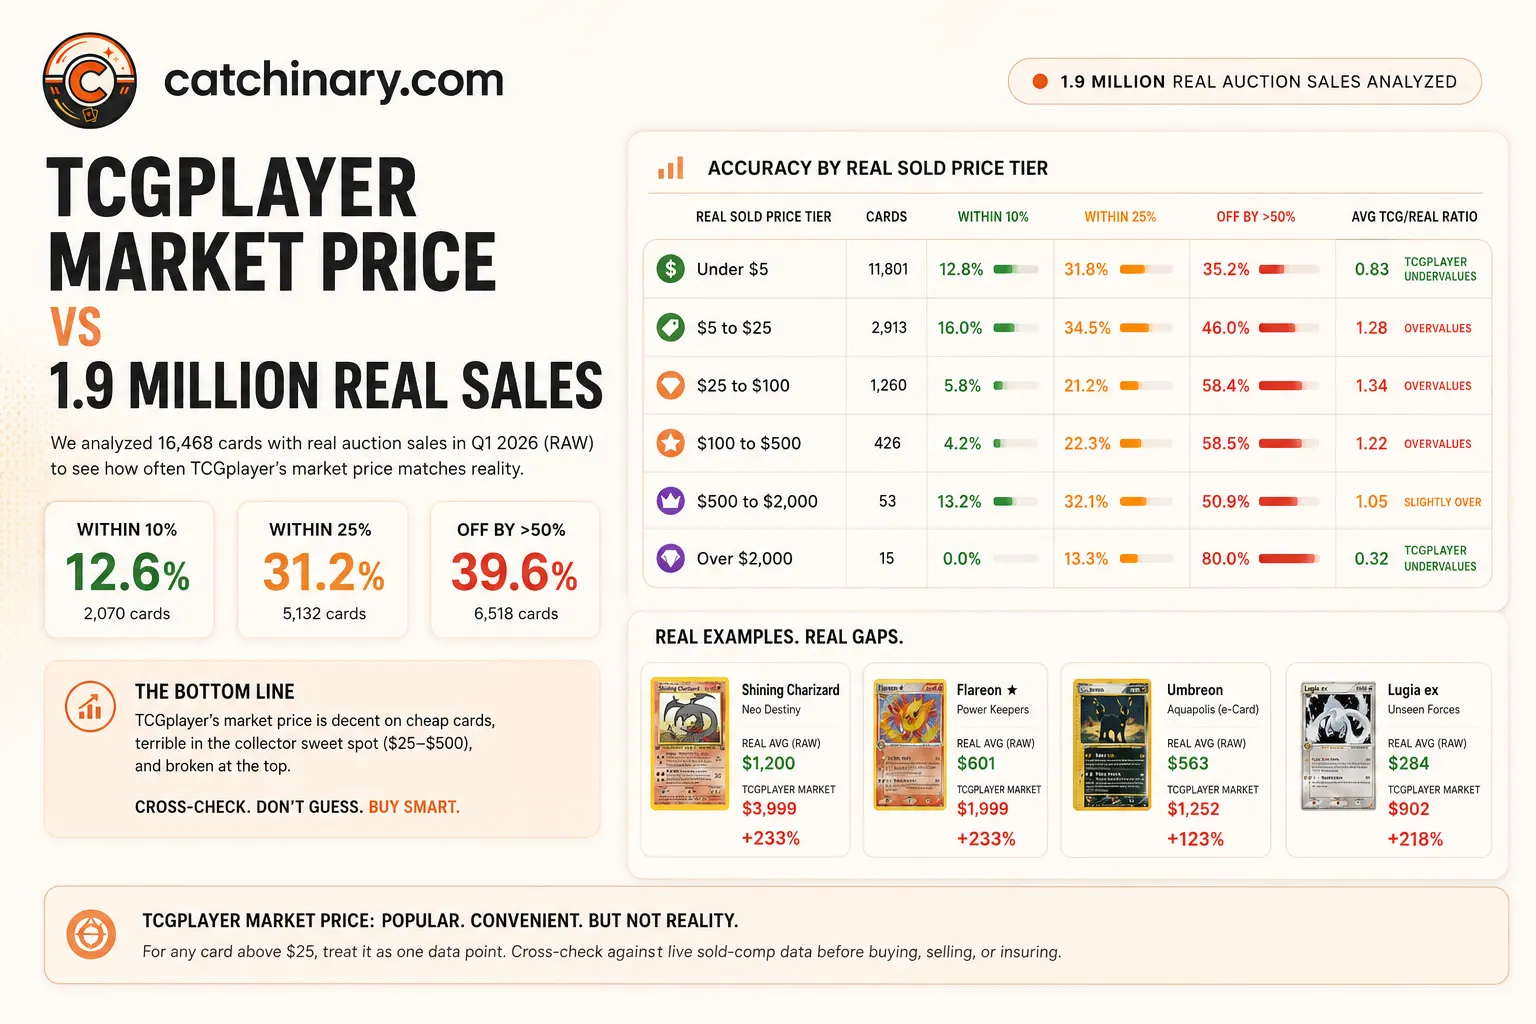
The two endpoints aren't symmetric. The under-$5 tier scores 15.0% within 10% accuracy (decent, because absolute miss is small even when percent miss is large), and the over-$2,000 tier collapses to 0.0% within 10%. The middle is where the floor falls out: in the $25 to $500 band, only 5 to 7% of cards have a TCGplayer market price within 10% of real sales.
The direction also flips. The average TCG/real ratio runs 1.44 to 1.56 in the $25 to $500 band, meaning TCGplayer's number is on average 44 to 56% above what the card actually sells for. At the over-$2,000 tier the ratio collapses to 0.28, meaning TCGplayer's number is on average just over a quarter of what the card actually realizes at auction.
Worst offenders (named)
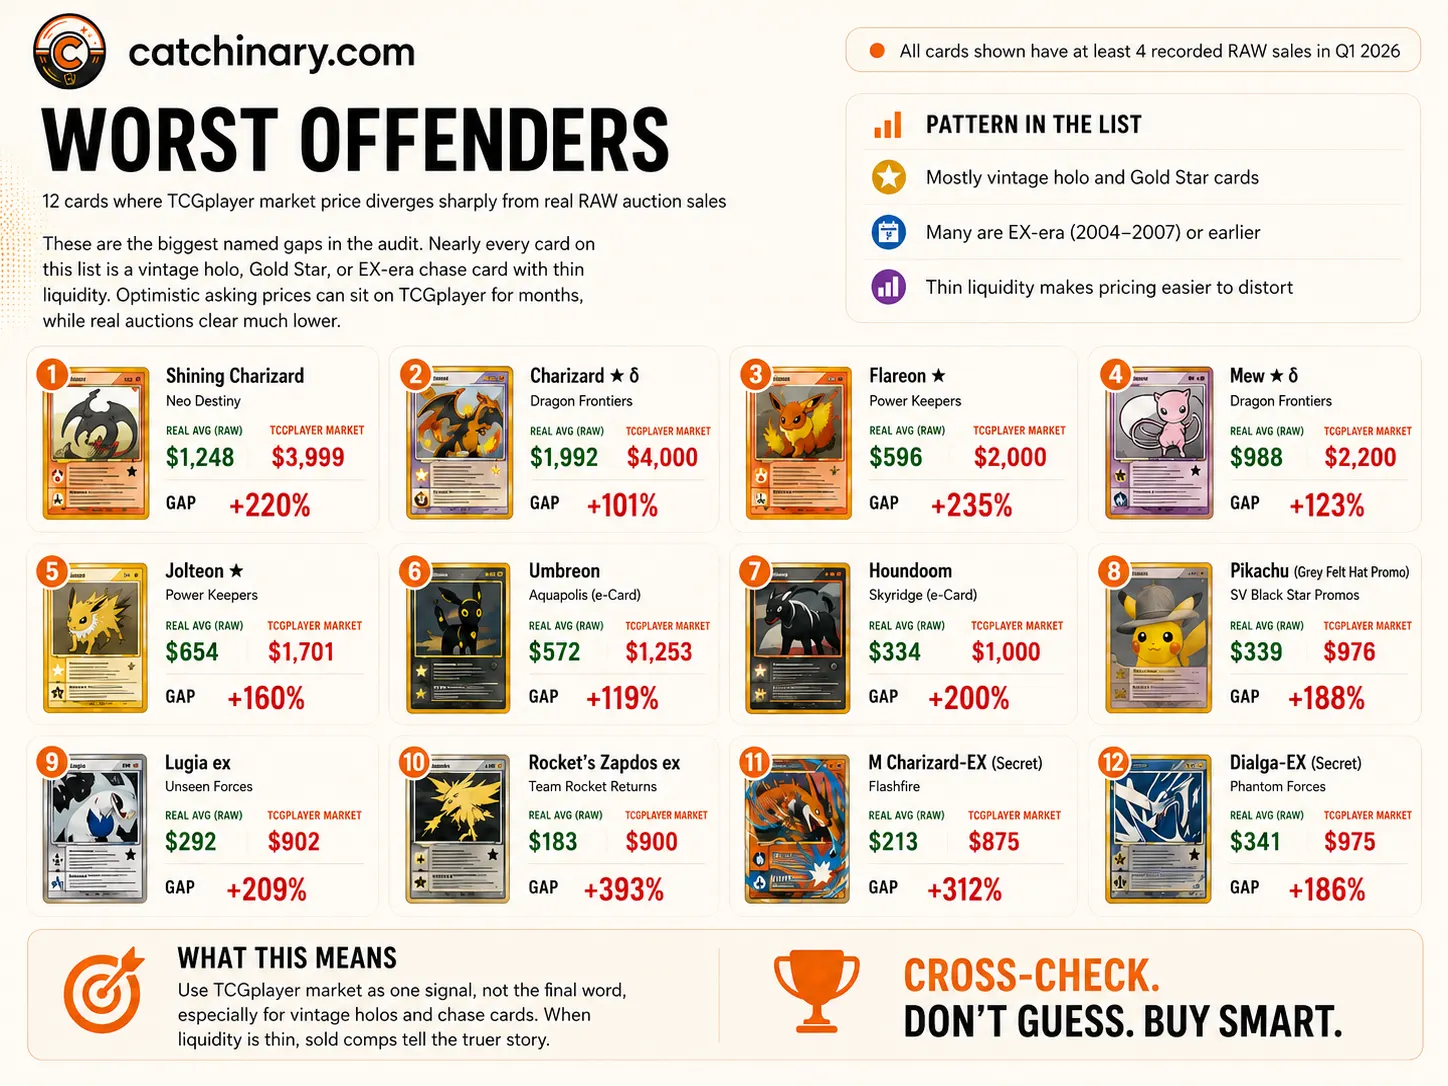
Twelve specific cards where the gap is large enough to actively mislead anyone using TCGplayer market as their primary signal. All have at least four recorded RAW sales in Q1 2026.
Each card below links to its live Catchinary page with daily price history, eBay sold listings, and PSA APR data.
- Shining Charizard Neo Destiny
- Charizard ★ δ Dragon Frontiers
- Flareon ★ Power Keepers
- Mew ★ δ Dragon Frontiers
- Jolteon ★ Power Keepers
- Umbreon Aquapolis (e-Card)
- Houndoom Skyridge (e-Card)
- Pikachu (Grey Felt Hat Promo) SV Black Star Promos
- Lugia ex Unseen Forces
- Rocket's Zapdos ex Team Rocket Returns
- M Charizard-EX (Secret) Flashfire
- Dialga-EX (Secret) Phantom Forces
The pattern in this list is consistent. Almost every overstated card is a vintage holographic or Gold Star from the EX-era (2004-2007) or earlier.
These cards have thin liquidity. A handful of optimistic asking prices sit on TCGplayer for months.
A small number of sales actually clear at the high asking price, usually to a buyer who hasn't checked auction comps. That is enough to drag the market figure up.
The auction houses, meanwhile, see far more volume on these cards and the realized prices run sharply lower.
Why this happens
The structural reason is volume. TCGplayer's market price calculation appears to weight its own marketplace sales heavily.
For high-volume modern singles (a Surging Sparks Pikachu ex SIR, say) that works fine, because hundreds of sales per week converge on a tight price band.
For low-volume vintage cards, two or three sales in a 60-day window is normal. One outlier listing, or one sale to an uninformed buyer, can swing the figure 30 to 50%.
The opposite problem hits at the top. Cards like a PSA 10 Trophy Pikachu or a sealed Base Set booster box don't trade on TCGplayer at all.
They trade at Heritage Auctions, PWCC, Goldin, or in private sales. TCGplayer's market figure for these cards reflects whatever sparse marketplace activity exists, which is almost always a singles-only secondary slice running well below the true auction-clearing price.
This is also why our earlier pull-rate EV math uses Catchinary's sold-comp database rather than TCGplayer market figures.
The same logic applies to the Flareon Gold Star deep dive: the TCGplayer price guide for that card sat near $2,000 when we wrote it, while the strict-audit median of real RAW sales for Q1 plus April 2026 lands at $596.
Who actually sets the "market price"?
TCGplayer doesn't type prices in by hand. Third-party sellers list cards at whatever price they want, buyers occasionally clear those listings, and TCGplayer's algorithm computes the "market price" field from those cleared transactions.
But TCGplayer owns every step after the listing: which sales the algorithm weights, how it handles outliers, how it treats thin-volume cards, and whether it publishes the figure as authoritative.
For modern singles trading hundreds of times a week, the algorithm has plenty of signal to work with. For vintage Gold Stars trading two or three times in 60 days, the algorithm is averaging a sample of two, with no public outlier filter. The published figure inherits whatever noise sits in that tiny sample.
TCGplayer also earns commission on every sale. Higher market prices mean higher commissions per transaction and a higher anchor for the next seller deciding what to list at. The algorithm's blind spots all happen to point in the direction that benefits the platform.
What collectors should do
The takeaway isn't "TCGplayer is broken, ignore it." For a $5 modern single that trades 200 times a day, the market figure is fine.
The takeaway is that the reliability of TCGplayer market is non-uniform, and the cards where collectors most need a reliable price (the mid-tier vintage holos and the high-end chases) are exactly where it's least reliable.
Use this quick-reference matrix to decide how much to trust TCGplayer's number on any given card, and where to look instead when it's not reliable.
Practical workflow for valuing a card above $25:
- Pull TCGplayer market as one data point.
- Check eBay sold listings for the same condition in the last 30 days. Sort by sold date, ignore best-offer prices that don't show the accepted figure.
- For graded cards, check PSA Auction Prices Realized for the specific grade.
- If the card has cleared $1,000 historically, check Goldin and PWCC archives.
- Use Catchinary's daily price history chart to see how the card has trended over the past 30 days.
Where these signals disagree by more than 30%, the answer isn't to pick one. The answer is that the card doesn't have a precise "market price" right now.
Set a range, not a point.
For a card with a $1,200 real average and a $4,000 TCGplayer market, the honest answer is "this card sells for between $1,000 and $1,500 to informed buyers, and TCGplayer's number reflects optimistic asking prices that occasionally clear to uninformed ones."
Despite the market-price reliability issues above, TCGplayer remains the largest English Pokemon TCG singles marketplace, with the deepest seller pool and the quickest fulfillment for most in-stock singles.
Catchinary's "Buy on TCGplayer" buttons are still the right call for actually completing a purchase. The audit is about trusting their price field as a valuation signal, not about avoiding their marketplace.
Catchinary is a TCGplayer affiliate via Impact.com and earns commission on purchases initiated from "Buy on TCGplayer" buttons on this site. We published this audit because the data integrity matters more to us than the comfort of the partner relationship.
FAQ
Is TCGplayer market price reliable?
For high-volume modern singles trading every day, yes. For mid-tier vintage rares ($25 to $500) and ultra-chase cards ($2,000+), no. Only 14% of cards in our 14,734-card audit had a TCGplayer market price within 10% of the real sold median. The number falls below 8% for cards in the $25 to $500 range.
Where does TCGplayer's market price come from?
TCGplayer derives the market price from its own marketplace sales. The exact formula isn't published, but it appears to weight recent transactions heavily. For thinly traded cards with one or two sales in the past month, a single outlier listing or sale can shift the figure by 50% or more.
Why does TCGplayer overstate some cards and understate others?
For mid-tier vintage rares, optimistic asking prices stick on the listing page longer than sold prices, and a small number of overpriced sales drag the market figure upward. For ultra-rare chase cards, real sales happen off-marketplace at auction houses, so TCGplayer's number reflects only the few private-sale singles posted there, which run well below auction realizations.
What dataset did Catchinary use for this audit?
1,901,586 real sold-auction records spanning 2006 to 2026, covering 17,440 distinct cards across PSA, BGS, and raw grades. The current (v2) audit filtered to cards with at least four monthly RAW data points in Q1 plus April 2026, dropped any month outside half-to-double the card's median, and excluded Common/Uncommon-rarity rows priced above $20 (upstream classification noise). That left 14,734 cards. The reproducible query lives at scripts/run-strict-divergence-audit.mjs with the full JSON dump at scripts/strict-audit-results.json.
How should I value cards if TCGplayer market is unreliable?
Cross-check TCGplayer market against eBay sold listings (filter to the last 30 days, sold-only), PSA Auction Prices Realized for graded cards, and Catchinary's daily price history. For any card above $25, treat TCGplayer market as one signal among three, not as the answer. Our card valuation guide walks through the full workflow.